Opproplot
Binary classifier operating profile plots
Getting Started
This page shows how to generate an operating profile in a notebook and how to interpret it for common binary classifiers.
Setup
pip install -e .
import numpy as np
from opproplot import operating_profile_plot
Basic example
rng = np.random.default_rng(0)
y_true = rng.integers(0, 2, size=5000)
scores = rng.random(size=5000)
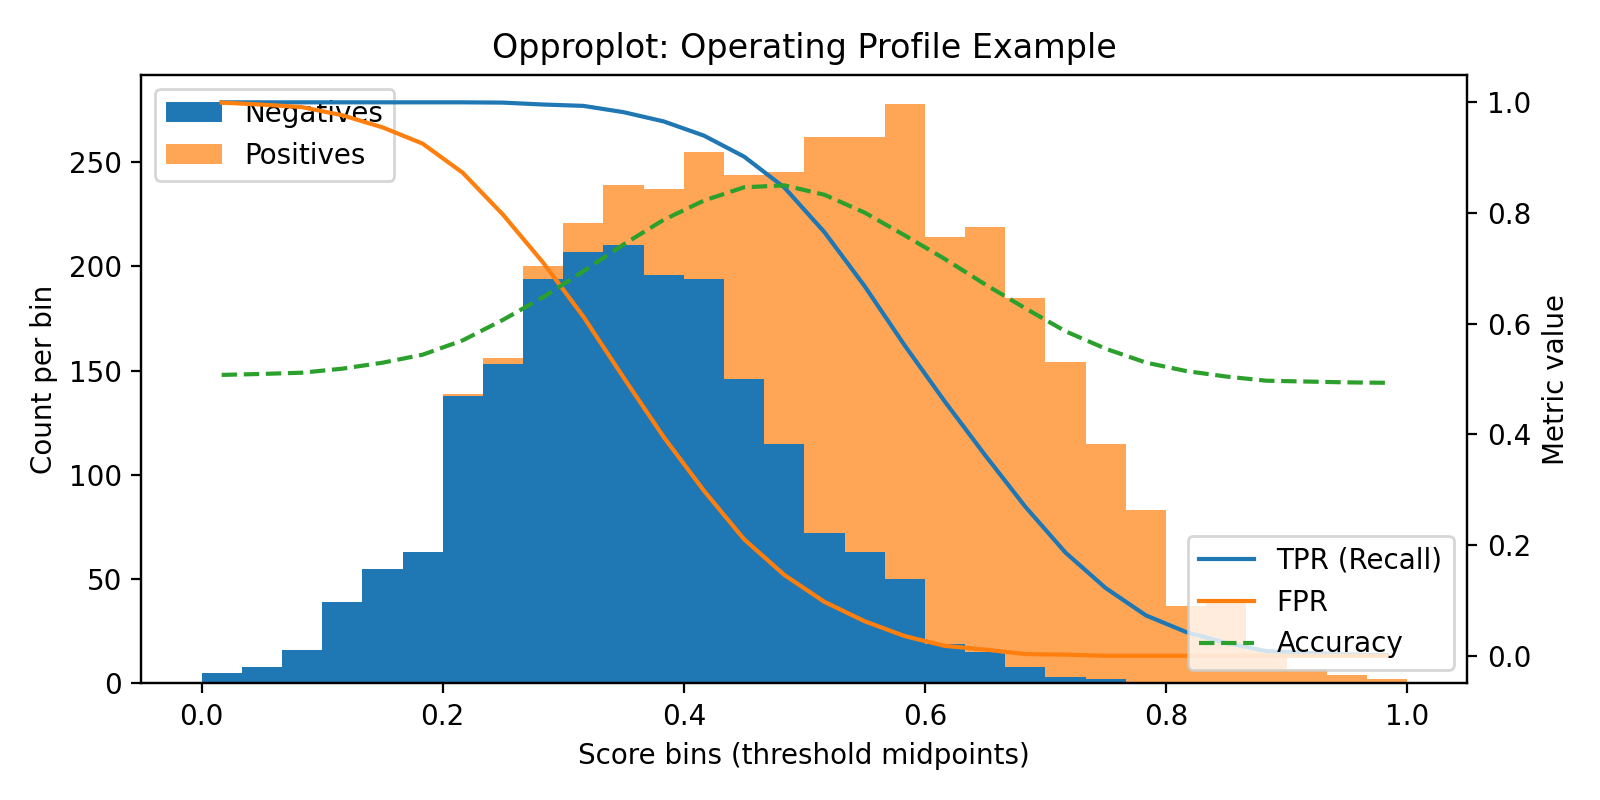
fig, ax_hist, ax_metric = operating_profile_plot(y_true, scores, bins=30)
- Left axis: stacked histogram of scores by class.
- Right axis: TPR, FPR, and Accuracy evaluated at each bin midpoint threshold.
- Choose thresholds where TPR/FPR trade-offs make sense for your application.
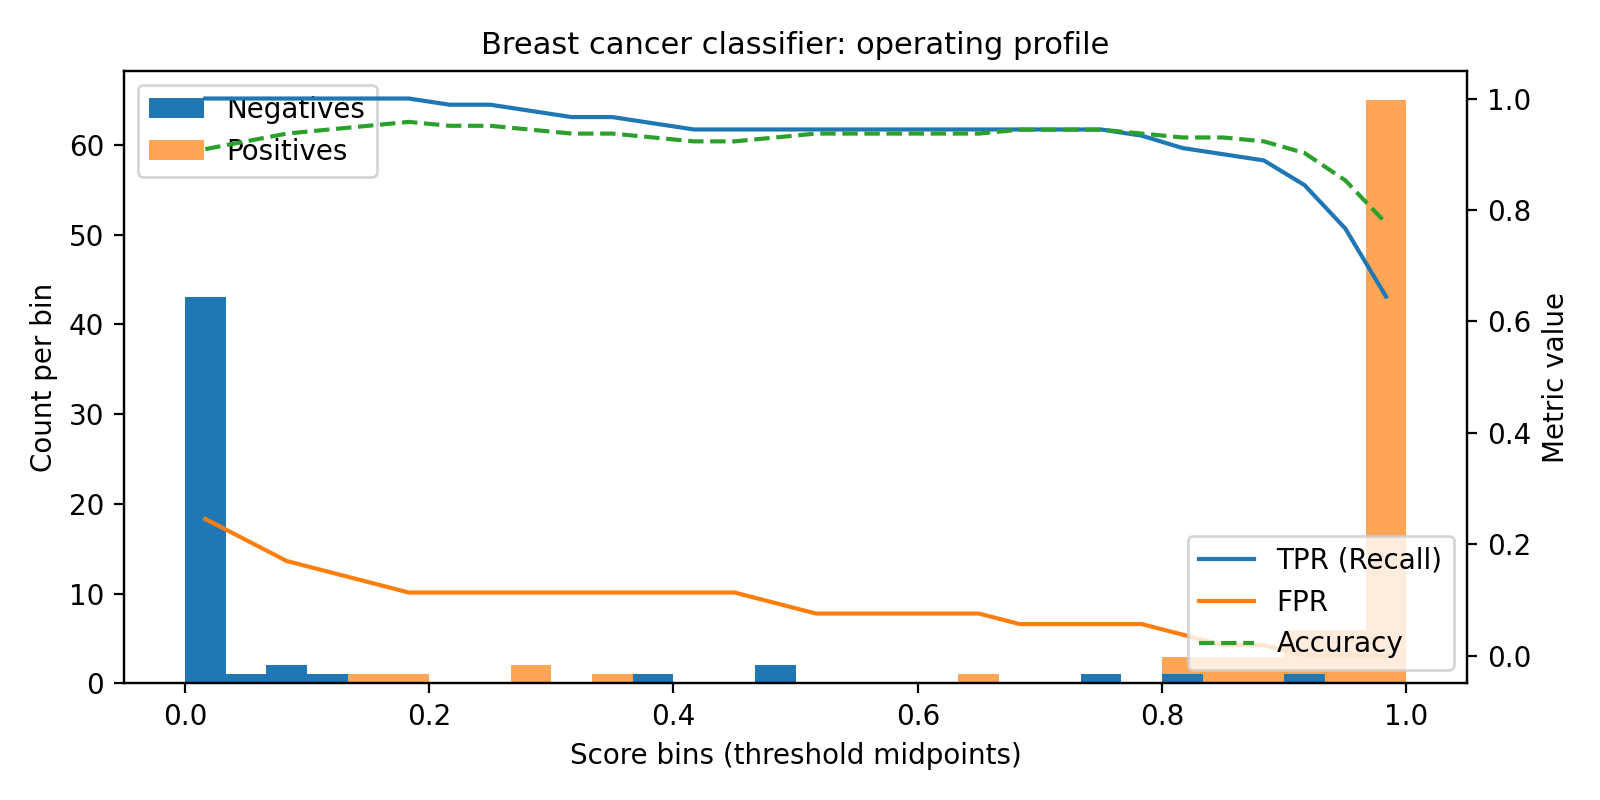
Detailed example (scikit-learn)
from sklearn.datasets import load_breast_cancer
from sklearn.model_selection import train_test_split
from sklearn.linear_model import LogisticRegression

data = load_breast_cancer()
X_train, X_test, y_train, y_test = train_test_split(
    data.data, data.target, test_size=0.3, random_state=0, stratify=data.target
)

clf = LogisticRegression(max_iter=500)
clf.fit(X_train, y_train)

y_score = clf.predict_proba(X_test)[:, 1]

fig, ax_hist, ax_metric = operating_profile_plot(y_test, y_score, bins=30)
ax_hist.set_title("Breast cancer classifier operating profile")
Pattern applies to other models:
- Random forest / gradient boosting: use
model.predict_proba(X)[:, 1]. - XGBoost / LightGBM: use
predictoutputs as scores.
Interpreting the plot
- Separability: wider gap between class histograms indicates better discrimination.
- Threshold effects: steep TPR drops highlight sensitive regions.
- Accuracy peak: dashed accuracy curve shows the maximizer without trial-and-error.
For deeper theory and metric formulas, see Theory.